
Chrome DevTools Tricks Every Developer Should Know
Chrome DevTools is an essential toolkit for developers, providing powerful debugging, performance optimization, and testing capabilities. Whether you’re a front-end or full-stack developer, mastering DevTools can significantly improve your workflow. Here are some must-know Chrome DevTools tricks to enhance your productivity.
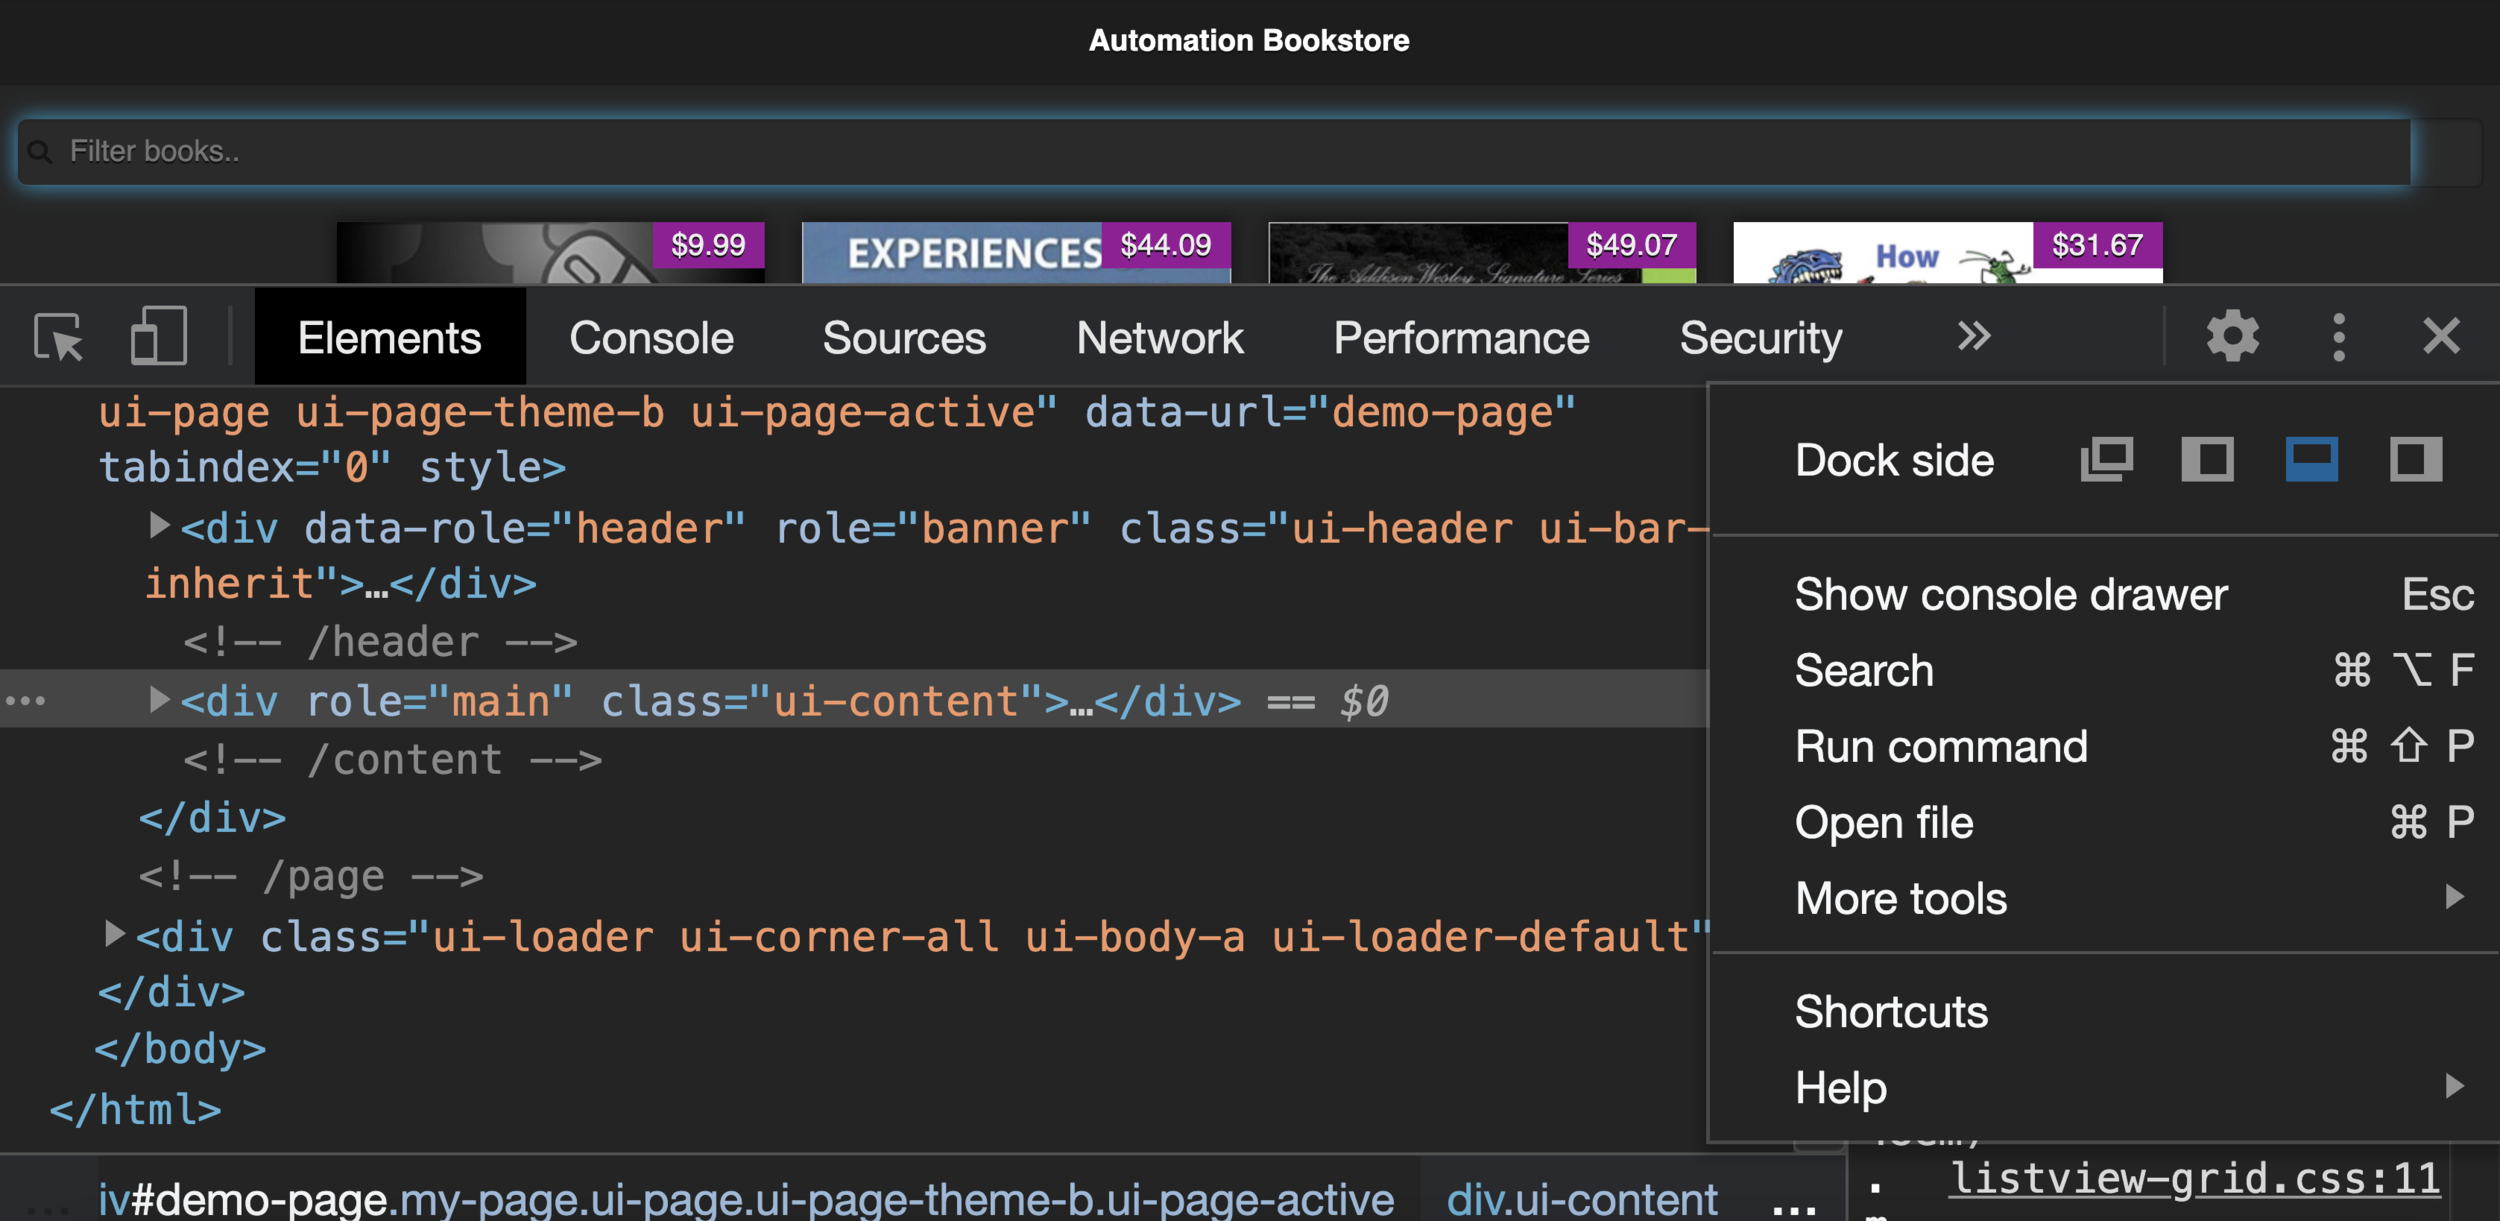
1. Inspect and Edit HTML/CSS in Real-Time
Right-click any element on a webpage and select Inspect to open the Elements panel. Here, you can modify HTML and CSS live, experiment with styles, and see instant changes without touching your source code.
Bonus Tip:
- Use the :hover, :focus, :active state toggles to test pseudo-classes in the Styles panel.
2. Debug JavaScript with Breakpoints
Instead of using console.log(), leverage breakpoints for efficient debugging. Navigate to the Sources panel, click on a line number to set a breakpoint, and DevTools will pause execution when that line runs.
Useful Breakpoints:
- DOM Breakpoints – Pause when an element changes.
- XHR Breakpoints – Pause on network requests.
- Event Listener Breakpoints – Pause on specific user interactions.
3. Network Throttling for Testing Performance
Simulate slow networks to test how your website behaves under different conditions. In the Network panel, click on the Throttling dropdown and choose a preset like “Slow 3G” to emulate real-world loading scenarios.
4. Measure Page Performance with Lighthouse
The Lighthouse panel in DevTools provides automated performance audits, helping identify bottlenecks in speed, SEO, accessibility, and best practices. Click Generate report to receive actionable insights for improving your site.
5. Capture Full Page Screenshots
Need a full-page screenshot of a webpage? Open DevTools, press Cmd + Shift + P (Mac) or Ctrl + Shift + P (Windows) to open the Command Menu, then type Capture full-size screenshot and press Enter.
6. Use the Console for Quick Calculations and Testing
The Console panel is not just for logging errors. You can use it as a calculator, test JavaScript snippets, and even manipulate the DOM dynamically.
Examples:
console.log(document.title); // Prints the page title
$$('p'); // Selects all <p> elements (alias for document.querySelectorAll)
7. Simulate Mobile Devices with Device Mode
Test how your site appears on different screen sizes using Device Mode. Click on the mobile icon in DevTools or press Cmd + Shift + M (Mac) / Ctrl + Shift + M (Windows) to toggle between desktop and mobile views.
8. Edit and Resend Network Requests
In the Network panel, right-click a request and select Edit and Resend. Modify parameters (e.g., headers, request payload) and test API responses without modifying code.
9. Monitor Web Performance with the Performance Panel
Use the Performance tab to record and analyze how your website loads. Click Start profiling, interact with your site, then stop the recording to see detailed timing breakdowns.
10. Local Overrides to Test Changes Without Deploying
Want to test code changes locally without modifying the server? In the Sources panel, enable Local Overrides, modify the file, and Chrome will use your version instead of fetching the remote one.
By mastering these Chrome DevTools tricks, you’ll debug faster, optimize performance efficiently, and improve your overall web development workflow. Try them out today and take your development skills to the next level!
Do you have a favorite DevTools trick? Share it in the comments below!